If you want to take a look at the management future in communication and marketing, especially of content marketing - here you go. Here are some screenshots from our Content Dashboard.
WHAT DO WE SEE?
We see the interactive and fully integrated view of content (topics) and marketing (paid media). We see, in total or individually, all channels, all topics, all formats and budgets. Both for ongoing communications, and for campaigns. We see the central interactive basis for meetings for teams in day-to-day business, but also for management when they don't want to have (freely configurable) slide sets. We see a tool that supports all decisions that do not only concern a media silo.
WHAT IS IN IT?
All relevant data from internal and external sources. KPI on performance and quality of any digital communication measures, both content (topics) and marketing (paid media). The dashboard is fully interactive, a uniform KPI concept allows full freedom in the choice of object of observation and evaluation level. You can view and analyze everything per topic or campaign - at all levels, down to individual posts, pages or videos.
WHAT IS THIS GOOD FOR?
The Content Dashboard closes the gap between the boardroom and the creative and media departments. Both strategic controlling and topic/campaign planning are supported by a common tool. A new form of collaboration becomes possible.
Finally, KPI and data actually support decisions - by teams, not machines or tool experts. We're happy to explain how to get there.
THE SCREENSHOTS
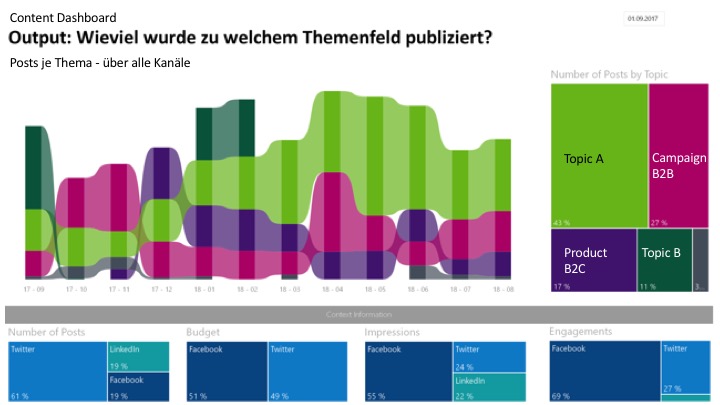
Here are 4 (static) dashboard states: they show how to look at a year of marketing communications across channels. Namely, standardized, interactive and predictive. We look forward to your questions!
- Published posts per topic - across all channels
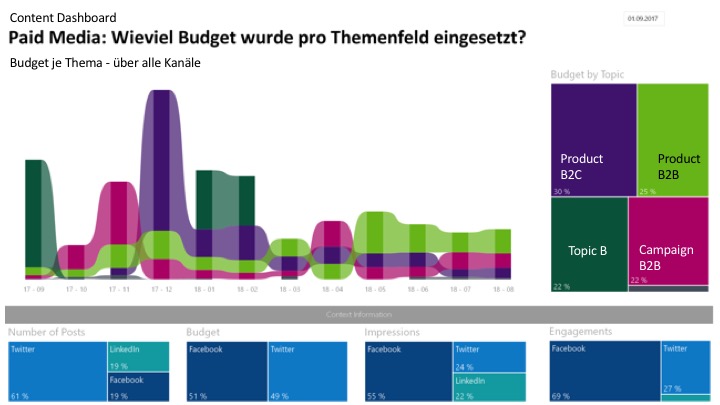
- Budget used per topic - across all channels
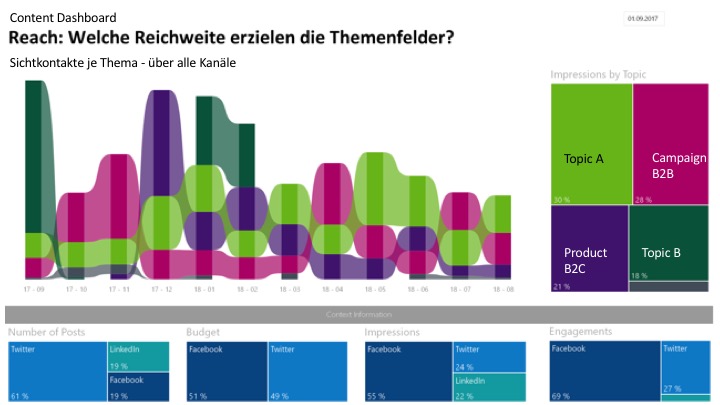
- Reach achieved per topic - across all channels
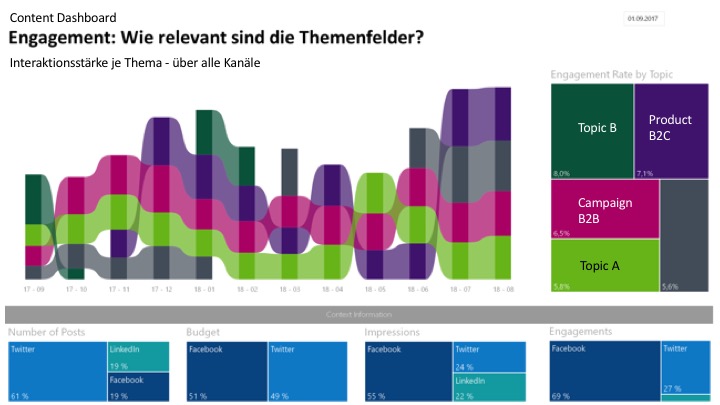
- Engagements achieved per topic - across all channels