Interpreting data, for example on social media usage, is as tedious as the work of a truffle pig. But wait, doesn't the pig have fun looking for truffles? It does, but that's no wonder; after all, it's not a bad-tempered bean counter like the gentlemen in our picture. Here's an example of what happens when you take a closer look at data with a little fun. We learn interesting things about the media industry and YouTube.
ARD/ZDF online study: a paradise for truffle pigs, but only for them.
The ARD/ZDF Online Study is an undisputed beacon for researchers and the industry. Among dozens of tables in the 2018 edition are two on social media use, which we'll grab now. They contain nearly 100 data points, or individual metrics. That's 93 data points too many.
Why? "Deliver a maximum of 7 different pieces of information" is the rule of thumb for human perception that all UX designers are taught. And it's simply true, as every life and design experience shows. So who on earth is supposed to take in 100 pieces of information, digest them, and then make something out of them? The answer: Nobody. Possibly helpful is an interpretation bot, a text robot, like companion programs it, if one processes many data uniformly enough.
We cook a truffle essence
So we simplify the two tables with the 100 data points, we have fun with it. To do this, we reproduce the abstract and multidimensional contexts and statements that characterize every statistic and then condense everything to 3×6 data points. The market researchers may forgive us the "lack of precision" (ahem, we work with arithmetic averages), you can just as well call it "intentional comprehensibility". We now take the 18 data points, there are still too many, and spread them over 2 slides. One suspects what Churchill wanted to say with these statistics, which one could trust only if one had falsified them oneself. He meant: reduction, extraction of subjectively relevant details.
That's how we did it, and we now have what we want, which is a result that humanoids can process without any special effort, special expertise, or special motivation. It's called simplification, it's our job, and we see interesting things.
Interesting facts about social media use in Germany 2018
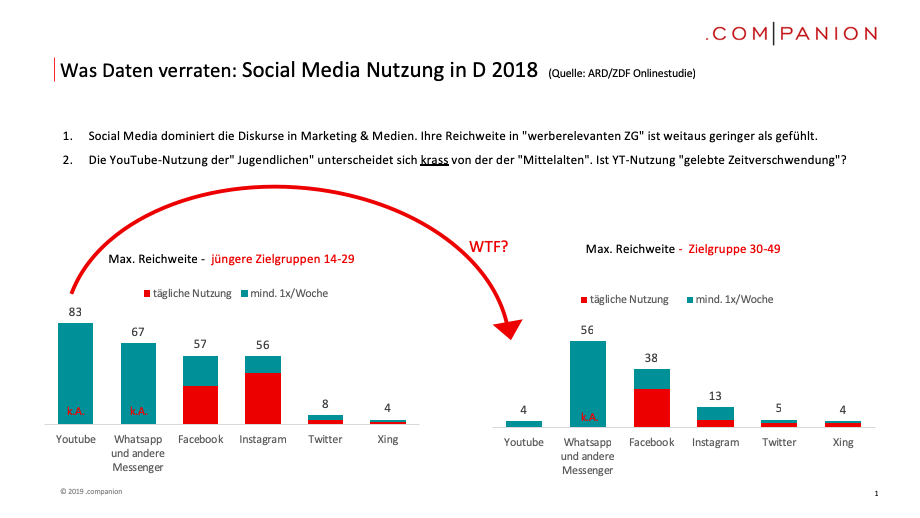
- Social media dominates the discourse in marketing & media. Their reach in "advertising-relevant ZG" is far less than perceived.
- The YouTube usage of the "Young people" differs crass from which the "Middle aged". Is YT use a "living waste of time"?
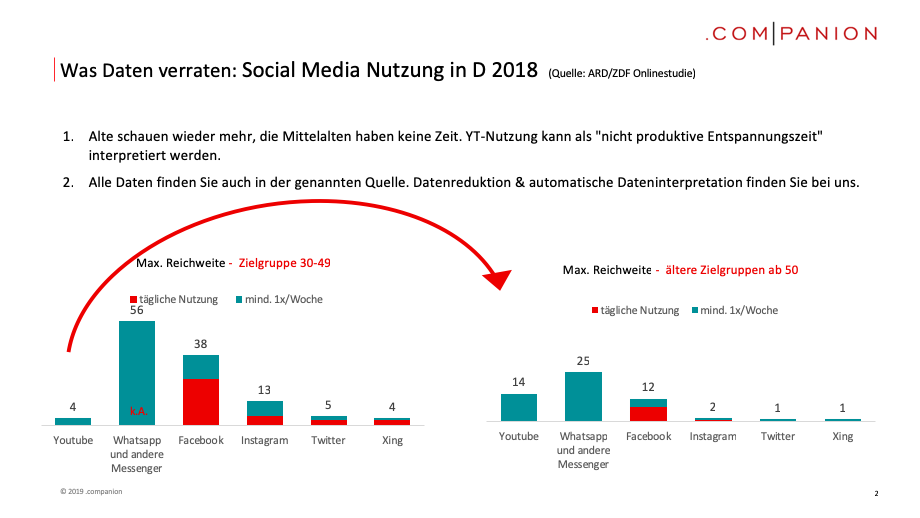
- Old people are watching more YouTube again, the middle-aged have no time. YT use can be interpreted as "non-productive relaxation time".
- All data can also be found in the mentioned very recommendable source at ARD and ZDF. However, data reduction & data interpretation (if necessary also automatically) can only be found with us.